
In the constantly evolving world of trading, tools can make or break your game. One such tool that has gained significant attention among traders is the Supertrend indicator. This isn’t just another flashy addition to your chart; it’s a powerful resource when used correctly. Let’s dive into what makes this tool so unique, how it functions, and why it deserves a spot in your trading arsenal.
What Exactly Is the Supertrend Indicator?
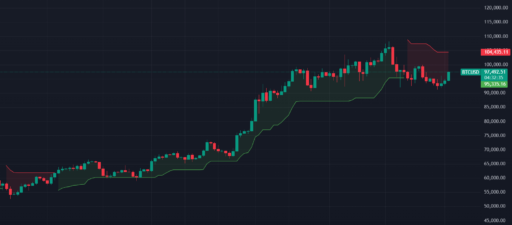
The Supertrend indicator isn’t some mystical, overly complicated system. At its core, it’s a straightforward trend-following tool designed to help traders identify the prevailing market direction. Unlike some indicators that leave you guessing, this one plots clear signals directly on your chart. It’s visually simple yet highly effective.

In essence, the Supertrend works by combining price action with volatility. It overlays the chart with a line that shifts between bullish and bearish zones based on current market trends. When the price crosses above the line, it signals a potential buy opportunity; when it drops below, it suggests a sell. The simplicity of this concept makes it accessible for both beginners and seasoned traders.
Why Traders Gravitate Toward It
One of the standout features of this indicator is its versatility. It doesn’t matter if you’re trading forex, stocks, crypto, or commodities; the Supertrend adapts seamlessly. Its ability to work across multiple timeframes adds another layer of flexibility. Swing traders, day traders, and scalpers alike can find value in its signals.
Another reason for its popularity is the clarity it provides. Markets often feel chaotic, with prices moving in unpredictable waves. This tool cuts through that noise, offering a cleaner perspective on what’s happening. It’s like having a compass in the middle of a storm.
How It’s Calculated
Behind the simplicity of the Supertrend lies a mathematical formula. It uses two key components: the Average True Range (ATR) and a multiplier. The ATR measures market volatility, while the multiplier adjusts the sensitivity of the indicator. Together, they create a dynamic system that responds to changing market conditions.
Here’s how it works:
- The ATR calculates the average range of price movement over a specified period.
- The multiplier is applied to the ATR to determine the distance between the price and the Supertrend line.
- Based on this calculation, the line shifts above or below the price, signaling bullish or bearish conditions.

The beauty of this calculation is its adaptability. By tweaking the ATR period or multiplier, traders can customize the indicator to suit their preferred trading style.
Setting It Up on TradingView
Getting started with the Supertrend indicator on TradingView is a breeze. First, open your TradingView account and select the chart of the asset you want to analyze. Then, navigate to the “Indicators” tab, search for “Supertrend,” and click to add it to your chart. It’s that simple.

Once it’s on your chart, you’ll notice the default settings. These typically include an ATR period of 10 and a multiplier of 3. However, don’t be afraid to experiment. Adjusting these settings can significantly impact how the indicator responds to price movements.
Practical Applications
The Supertrend indicator isn’t just for identifying trends; it has multiple practical applications. For instance, it can serve as a trailing stop-loss tool. By following the Supertrend line, you can lock in profits while giving your trades room to breathe.
Another use case is its ability to filter trades. Combining the Supertrend with other indicators, such as moving averages or RSI, can help confirm signals and reduce false entries. It’s not about relying solely on one tool but building a system that works cohesively.
Common Pitfalls and How to Avoid Them
While the Supertrend is undoubtedly powerful, it’s not infallible. Like any indicator, it has limitations. One common mistake traders make is blindly following its signals without considering market context. For example, during sideways markets, the Supertrend can generate false signals, leading to unnecessary losses.
To mitigate this, always analyze the broader market structure. Look for confluence with other indicators or chart patterns. Additionally, avoid over-optimizing the settings. While it may be tempting to tweak the ATR and multiplier endlessly, this can lead to curve-fitting, where the indicator performs well in backtesting but fails in live markets.
Real-World Examples
Let’s bring this concept to life with a couple of examples. Imagine you’re trading Bitcoin on a one-hour chart. The Supertrend flips bullish, signaling a potential buy. You enter the trade and set your stop-loss just below the Supertrend line. As the price climbs, the line adjusts, allowing you to trail your stop and lock in profits. Eventually, the price reverses, hitting your stop-loss, but you’ve secured a tidy profit.
Now, consider a different scenario. You’re trading Tesla stock, and the Supertrend flips bearish. Instead of entering immediately, you wait for confirmation from the RSI, which shows overbought conditions. This added layer of confirmation increases the reliability of the signal, reducing the likelihood of a false entry.
Adapting It to Your Strategy
The true power of the Supertrend lies in its adaptability. No two traders are alike, and neither are their strategies. Some prefer short-term trades, while others focus on long-term trends. The Supertrend can accommodate both.
For short-term traders, using a lower ATR period and multiplier can make the indicator more sensitive to price movements. This is particularly useful for scalpers looking to capture quick profits. On the other hand, long-term traders might prefer higher settings to filter out noise and focus on significant trends.
Final Thoughts
The Supertrend indicator on TradingView is more than just a trend-following tool; it’s a versatile resource that can enhance your trading strategy. Its simplicity, adaptability, and effectiveness make it a favorite among traders of all levels.
However, like any tool, its success depends on how you use it. Blindly following signals without considering market context or combining it with other tools can lead to subpar results. But when used thoughtfully, the Supertrend can be a game-changer.
So, the next time you’re analyzing a chart, give the Supertrend a try. Experiment with its settings, combine it with other indicators, and see how it fits into your strategy. Who knows? It might just become your new favorite tool.


